If you find yourself using a newer SDK to build an iOS or MacOS app for an older OS version, Xcode allows you to set the deployment target to the lower OS version. It will automatically weak-link the symbols, so they are imported at run-time. That means you need to carefully check your code to see where you are using these newer symbols. In those places, make sure you test to see if the symbol (method, enum, class, constant) is available before using it.
The compiler can find these weakly imported symbols for you. In Xcode 5, the magic macros to automatically check where you are using from the SDK that are not available in your deployment target OS are below. Here, they will flag the symbols that were introduced in 6.0 and newer. Useful if you’re still targeting iOS 5. Adapt to your situation (SDK/deployment target) and add to your precompiled headers to run the checks.
#undef __NSi_6_0

#define __NSi_6_0 deprecated=1.0

#undef __NSi_6_1

#define __NSi_6_1 deprecated=1.0

#undef __NSi_7_0

#define __NSi_7_0 deprecated=1.0
#undef __NSd_6_0
#define __NSd_6_0
#undef __NSd_6_1
#define __NSd_6_1
#undef __NSd_7_0
#define __NSd_7_0
October 24th, 2013 in
Uncategorized |
No Comments
My previously fine project suddenly didn’t build anymore. Xcode failed to link static libraries, because it was trying to link them as executables. Fortunately that was quite apparent in the error messages for undefined symbols, such as:
"_compress", referenced from:

      dami::io::CompressedWriter::flush() in io_decorators.o

  "_main", referenced from:

     implicit entry/start for main executable
As it turns out, my xcconfig file contained an empty value for the target’s binary type (key “MACH_O_TYPE”). I guess previously Xcode inferred the binary type by looking at the extension, if this value was not set. The correct line is below, but you can also find the setting in the project editor in Xcode.
MACH_O_TYPE = mh_execute
October 3rd, 2013 in
Uncategorized |
No Comments
Some people find math beautiful. And the wonderful wxMaxima certainly helps to take some of the tedium out of it. But, aesthetics aside, seeing math in action in magazine print quality on a MacBook with Retina display at least makes it easier on the eyes.
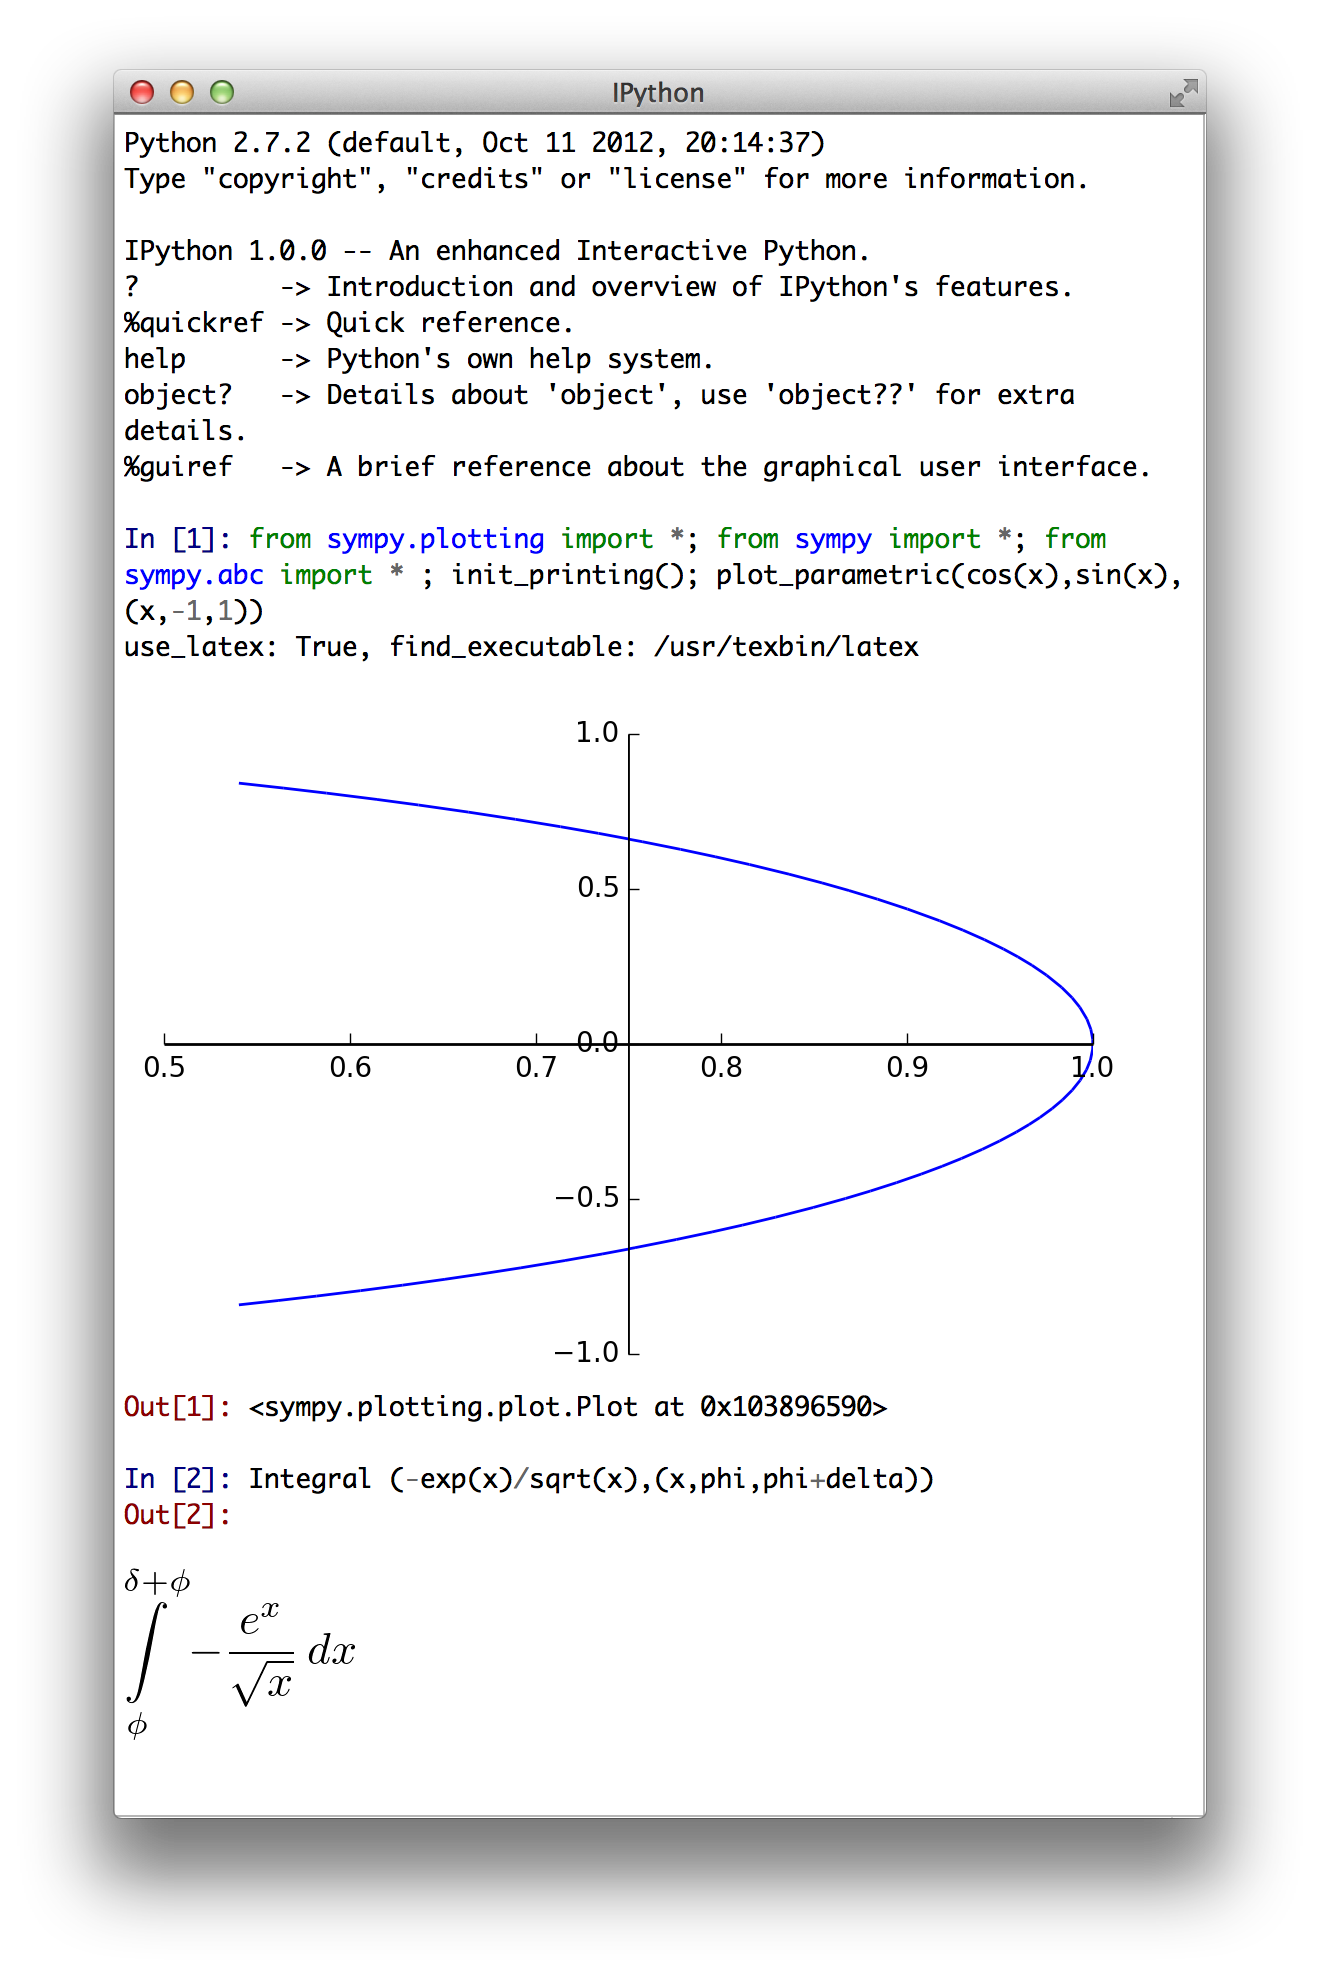
Unfortunately, both wxMaxima and Sympy in the currently released versions fail to support Retina displays. Then again, fortunately it is relatively easy to add that support to both. Because both wxWidgets and QT (the user interface platforms that are used by Maxima and Sympy, respectively) do have Retina support, it’s quite trivial to adapt the code.
And that takes you from (note: following images need retina display to be appreciated, Sympy screenshot below)

to:

Sympy with Latex and Matplotlib inlined at 220 dpi:
August 26th, 2013 in
Uncategorized |
No Comments
Well, things certainly tend to come around. After almost exactly 6 years, I once again find myself wanting to programmatically pause a program at interesting times for inspection using gdb. Where the code decides what’s interesting, mind you, not the developer’s symbolic breakpoint. Those six years have brought a new platform (iOS) and three new CPU architectures, so that trusty macro referenced in the link needs some updating. And update it I did – see the code fragment below.
O, and by the way, that’s gdb in its friendly Xcode disguise, of course. There’s a limit to how much mental abuse I can take, and that limit is comfortably reached by having to manually manage memory in Objective-C. I feel your pain, my embedded hardware brethren.
What I want…
So, we need to insert some code to break at a certain point or condition. A staple assert (false) won’t do, because there’s only so much you can do after the assert fires the near-fatal SIGABRT signal. You won’t be able to continue the program, or rewind the program counter. You probably won’t be able to use all that symbolic debug information in a very meaningful way. Admittedly, you can probably set up signal handlers in the debugger to pause on SIGABRT, but being a developer, you will forget that at least on the one occasion when it really mattered. And sometimes the interesting time is just interesting, not the beginning of the end of your program.
But there are other signals! SIGINT is a fine candidate to bring up the debugger. It will catch the signal and generally save your life. But there’s a snag. And another snag. The first is that SIGINT will kill your program when not run under the debugger. Unless you set up a signal handler or sigmask, but you’ll only do that in at most one or two of your applications. This is bad, because I’ll often just Run, not Debug, development builds trusting Xcode to debug “just in time”. And this works fine for, e.g., segmentation violations. So why shouldn’t I have that for my programmatic breakpoints?
The second snag when using a plain kill is that the debugger will stop in the wrong stack frame. I have chosen the bold type to prevent the use of expletives. This frame mismatch requires me (and you, should you choose this ill-advised way) to navigate all of the two stack frames up to the point where your actual call (and probably the failed condition) is. Only two clicks of the “step out” button for the casual observer, but a huge productivity and mood sink for the developer who’s been observing the app not so casually for half an hour waiting for the bug to occur. This does not happen with gdb breakpoints. This does not happen with segmentation violations. So why should I have to put up with it for my programmatic breakpoints?
Read the rest of this entry »
October 11th, 2010 in
Uncategorized |
7 Comments